Incubator Digital Twin with NuRV monitoring service
Overview
This example shows how a runtime monitoring service (here NuRV[1]) can be connected to the Incubator digital twin to verify the runtime behaviour of the Incubator.
Simulated scenario
This example simulates a scenario where the lid of the Incubator is removed and later put back on. The Incubator has anomaly detection, which can detect anomalous behaviour such as the removal of the lid. When it detects an anomaly, the Incubator switches to an energy saving mode in which the heater is turned off.
The monitor checks that the energy saving mode is turned on within 3 simulation steps of an anomaly detection. The property for this is: \(G(anomaly \rightarrow (F_{[0,3]}\space energy\_saving))\). The monitor outputs the Unknown state as long as the property is satisfied and moves to the False state once it detects a violation.
The simulated scenario progresses as follows:
- Initialization: The services are initialized and the Kalman filter in the Incubator is given 2 minutes to stabilize. The anomaly detection algorithm sometimes detects an anomaly at startup even though the lid is still on. This disappears after about 15 seconds.
- After 2 minutes: The lid is lifted and an anomaly is detected. The energy saver is turned on shortly after.
- After another 30 seconds: The energy saver is manually disabled, producing a False verdict.
- After another 30 seconds: The lid is put back on and the anomaly detection is given time to detect that the lid is back on. The monitor is then reset, producing an Unknown verdict again. The simulation then ends.
Example structure
The diagram below shows the logical software structure of the example.
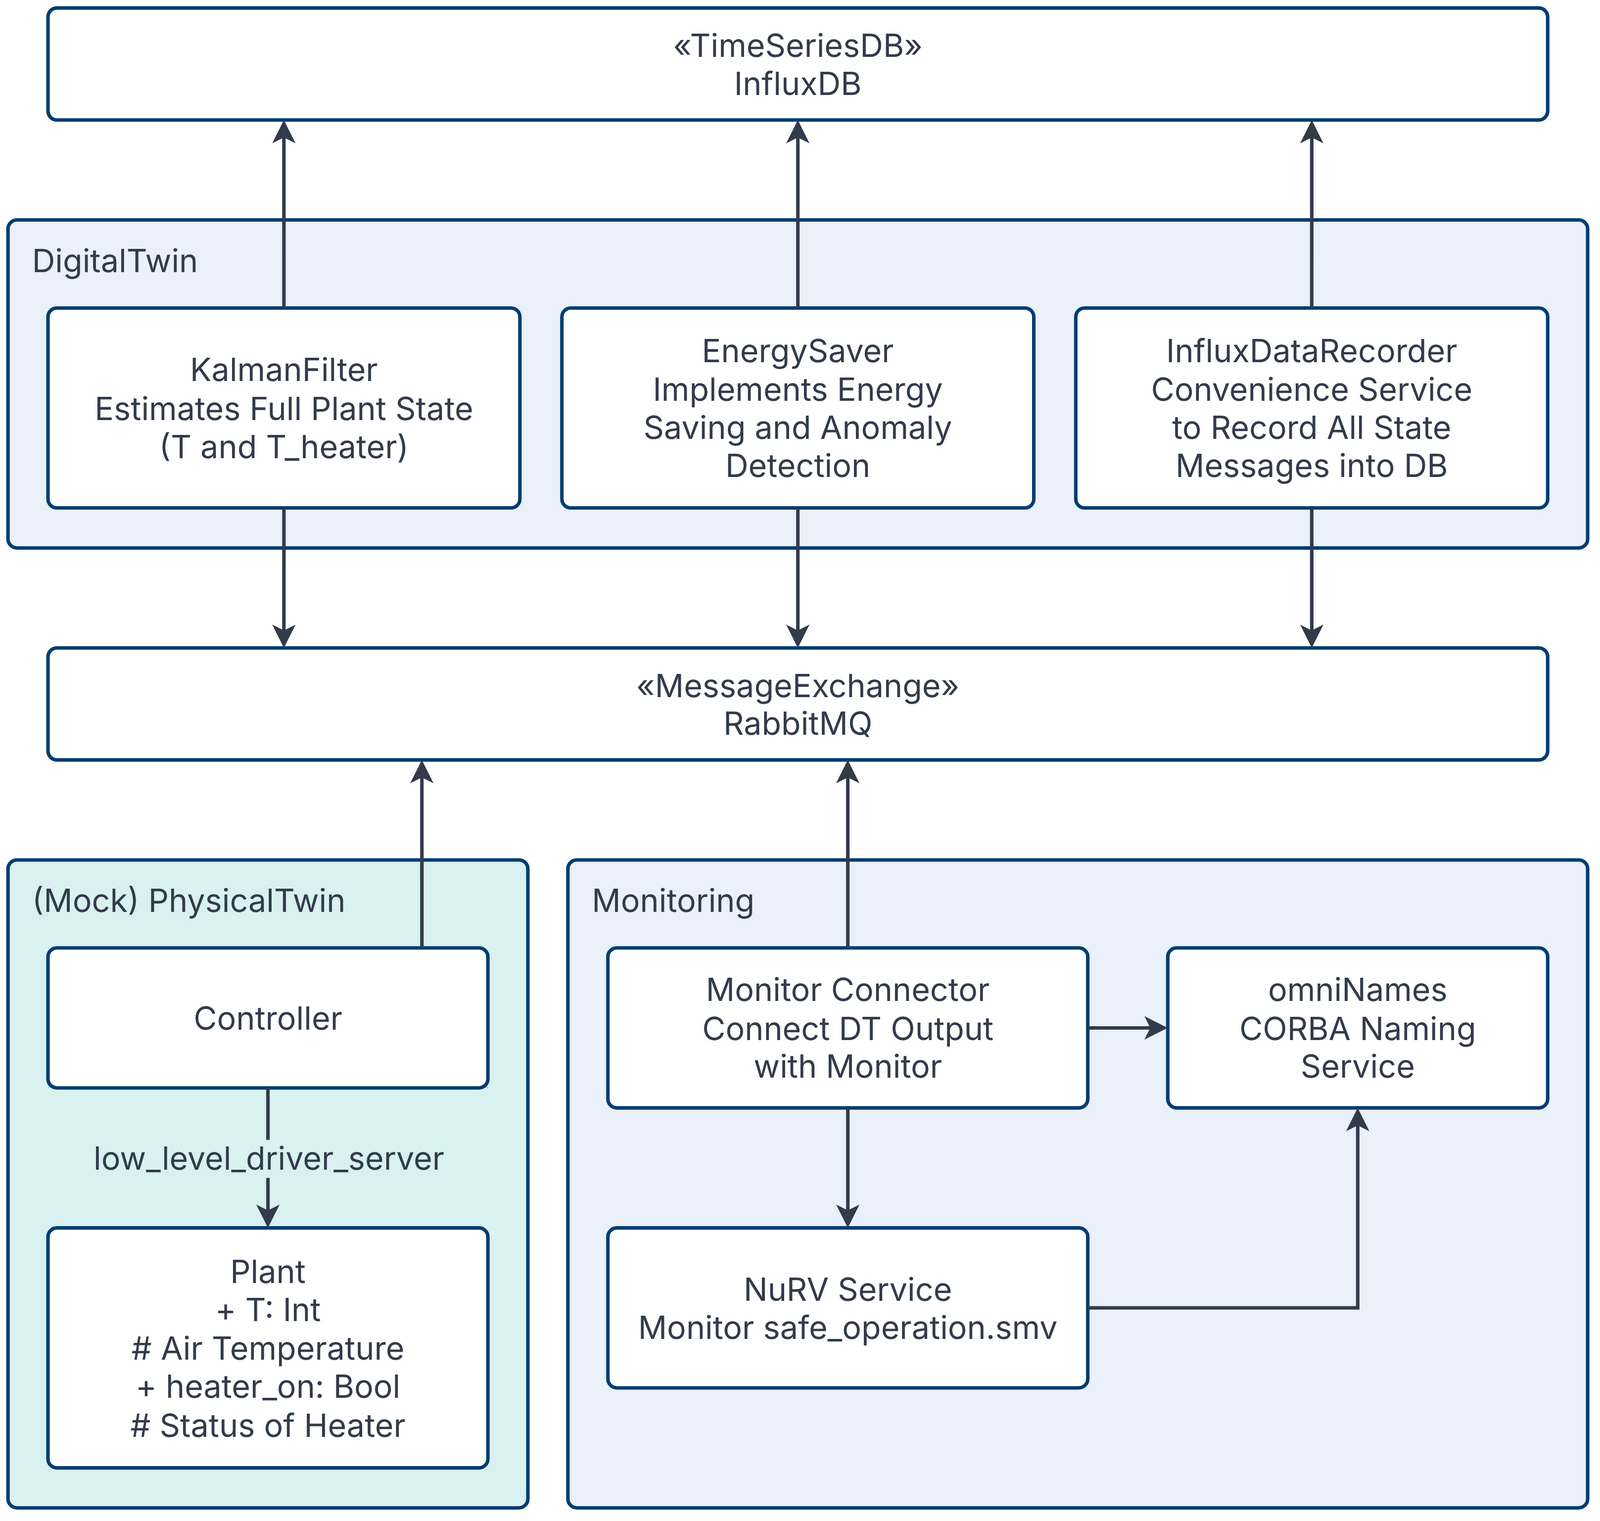
The execute.py script orchestrates and starts all the services in this example: the Incubator DT, the CORBA naming service (omniNames) and the NuRV monitor server. It also implements the Monitor connector component, which connects the DT output to the NuRV monitor server.
The NuRV monitor server registers under a specific name with a CORBA naming service. A client can query the naming service for that name to obtain a reference to the monitor server. For more information on how the NuRV monitor server works, refer to [1].
After the connection with the NuRV monitor server is established, the Incubator DT starts and a RabbitMQ client subscribes to changes in the anomaly and energy_saving states of the DT. Each time either state changes, the full state (the updated state and the last value of the other state) is pushed to the NuRV monitor server, and the verdict is printed to the console.
Digital Twin Configuration
Before running the example, configure the simulation.conf file with the appropriate RabbitMQ credentials.
The example uses the following assets:
| Asset Type | Names of Assets | Visibility | Reuse in other Examples |
|---|---|---|---|
| Service | common/services/NuRV/NuRV_orbit | Common | Yes |
| DT | common/digital_twins/incubator | Common | Yes |
| Specification | safe-operation.smv | Private | No |
| Script | execute.py | Private | No |
The safe-operation.smv file contains the default monitored specification described in the Simulated scenario section. It can be changed as needed.
Lifecycle phases
The lifecycle phases for this example are:
| Lifecycle phase | Completed tasks |
|---|---|
| create | Downloads the necessary tools and creates a virtual python environment with the necessary dependencies. The omniORBpy CORBA library is compiled from source because there are no packages of it for Python 3.12 |
| execute | Runs a python script that starts up the necessary services as well as the Incubator simulation. Various status messages are printed to the console, including the monitored system states and monitor verdict. |
| clean | Removes created data directory and incubator log files. |
If required, make the lifecycle scripts executable with the following command
where {script} is the name of the script, for example create or execute.
Running the example
To run the example, first run the following command in a terminal:
Then run the create script, which can take a few minutes depending on the network connection, followed by the execute script, using the following command:
The execute script then prints the system states and the monitor verdict about every 3 seconds, in the format "State: {anomaly state} & {energy_saving state}, verdict: {Verdict}", where "anomaly" means that an anomaly is detected and "!anomaly" means that no anomaly is currently detected. The energy_saving state uses the same format.
The monitor verdict can be False or Unknown. Unknown means that the monitor does not yet have enough information to decide whether the property is satisfied. Because of the G operator, the monitor never produces a True verdict: satisfaction can only be confirmed over the entire trace. The Unknown state can therefore be read as a tentative True verdict.
An example output trace is provided below:
The connection to the NuRV server often fails at startup and takes a few attempts to establish. The script retries automatically.
References
- Information on the NuRV monitor can be found on FBK website.