Water Tank Fault Injection with NuRV Runtime Monitor
Overview
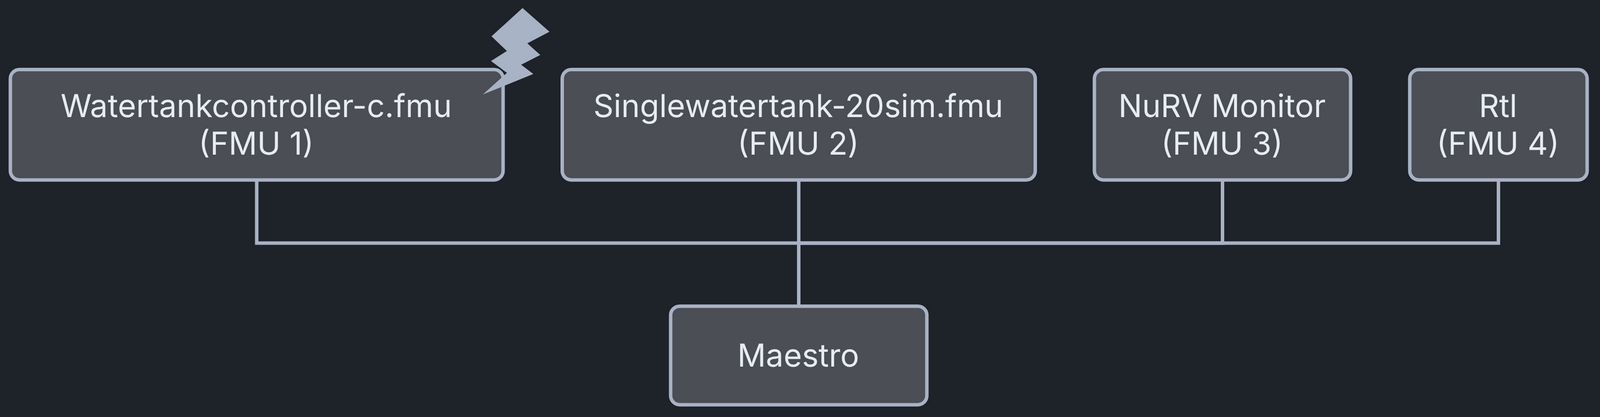
This example shows a digital twin (DT) with fault injection (FI). A live DT receives simulated faults from the environment. The faults are part of the DT configuration and can be changed for new instances of the DT. This version of the example adds a monitor generated by NuRV. More information about NuRV is available on the NuRV tool page.
This co-simulation based DT uses a water tank case study. The co-simulation
consists of a tank and a controller, and its goal is to keep the water level
in the tank between Level-1 and Level-2.
Faults are injected into the output of the water tank
controller (watertankcontroller-c.fmu) from 12 to 20 time units.
The faults close the tank outlet for a period of time, and the water level
rises above the desired level (Level-2).
A monitor added to the simulation checks at runtime whether the water level
stays below a maximum threshold.
Example Diagram

Example Structure

Digital Twin Configuration
This example uses four models, one specification and one tool:
| Asset Type | Names of Assets | Visibility | Reuse in Other Examples |
|---|---|---|---|
| Models | watertankcontroller-c.fmu | Private | Yes |
| singlewatertank-20sim.fmu | Private | Yes | |
| m1.fmu | Private | No | |
| RtI.fmu | Private | Yes | |
| Specification | m1.smv | Private | No |
| Tool | maestro-4.1.0-jar-with-dependencies.jar | Common | Yes |
The DT is executed with two configuration files, multimodelFI.json and
simulation-config.json. Edit them to customise the DT.
Note
The faults are defined in wt_fault.xml.
Lifecycle Phases
| Lifecycle Phase | Completed Tasks |
|---|---|
| Create | Installs Java Development Kit for Maestro tool Generates and compiles the monitor FMU |
| Execute | Produces and stores output in data/water_tank_FI_monitor/output directory |
| Analyze | Processes the co-simulation output and produces a plot |
| Clean | Clears run logs and intermediate co-simulation files |
Run the example
To run the example, change to the example directory.
If required, make the lifecycle scripts executable, for example:
Then run the following scripts.
Create
Installs Open Java Development Kit 21 and the pandas and matplotlib Python
packages from the Ubuntu repositories (python3-pandas and
python3-matplotlib). It then generates and compiles the monitor FMU from
the NuRV specification.
Execute
Runs the co-simulation and writes the outputs.csv file
to /workspace/examples/data/water_tank_FI_monitor/output.
Analyze phase
Processes the co-simulation output and saves a plot in
/workspace/examples/data/water_tank_FI_monitor/output/plots/.
Here is a sample plot.

The plot uses four colours. The blue line is the water level in the tank,
the orange line is the control output and the green line is the monitor's
verdict. The red dashed line marks the water level threshold that the
monitor checks. When the water level rises above this threshold, the
monitor's verdict changes from unknown (0) to false (2).
Examine the results
The results are in the /workspace/examples/data/water_tank_FI_monitor/output directory.
The run logs are in /workspace/examples/digital_twins/water_tank_FI_monitor.
Terminate phase
Removes the temporary files.
References
More details on this case study are in the paper:
The fault injection plugin extends the Maestro co-orchestration engine. It can replace the inputs and outputs of FMUs in an FMI-based co-simulation with tampered values. More details on the plugin are in the fault injection Git repository. The same repository holds the source code for this example in its example directory.